
One thing I often find myself trying to do is to read up on relevant literature within a new field. Often it’s difficult to identify seminal papers as a new-comer, so I’ve often wondered if there would be a way to quickly identify key papers.
Over Christmas I read two really good articles on creating networks in R: David Robinson‘s “love actually” network and Katherine Ognyanova‘s excellent guide to networks in R. I decided to give network analysis a shot myself, at first harvesting articles from PubMed and then visualizing their connections, using the R packages rentrez and igraph. The idea was to identify highly cited papers as a way to guide my reading.
The code I ended up with can be found here.
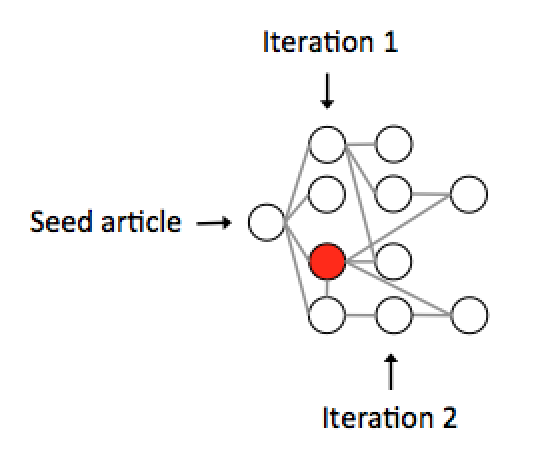
Basically what I did was the following: 1. download or scrape information on all other articles citing one “seed” article from PubMed. 2. Loop through all of these articles and find all articles that cite them. 3. Iterate for a couple of times (or levels as I call it in the code). 4. Visualize and export the data.
I used the excellent ROpenSci package rentrez, which utilizes E-utilities from NCBI to generate a nodes and links list for use in igraph afterwords. I loop through the nodes and edges in my script, but there are probably smarter ways to do this – it’s definitely slow to loop through the pubmed ID’s like this – but it worked.
In the end the result I got was this, using a Nature Immunology article from 2002 with 4 iterations:
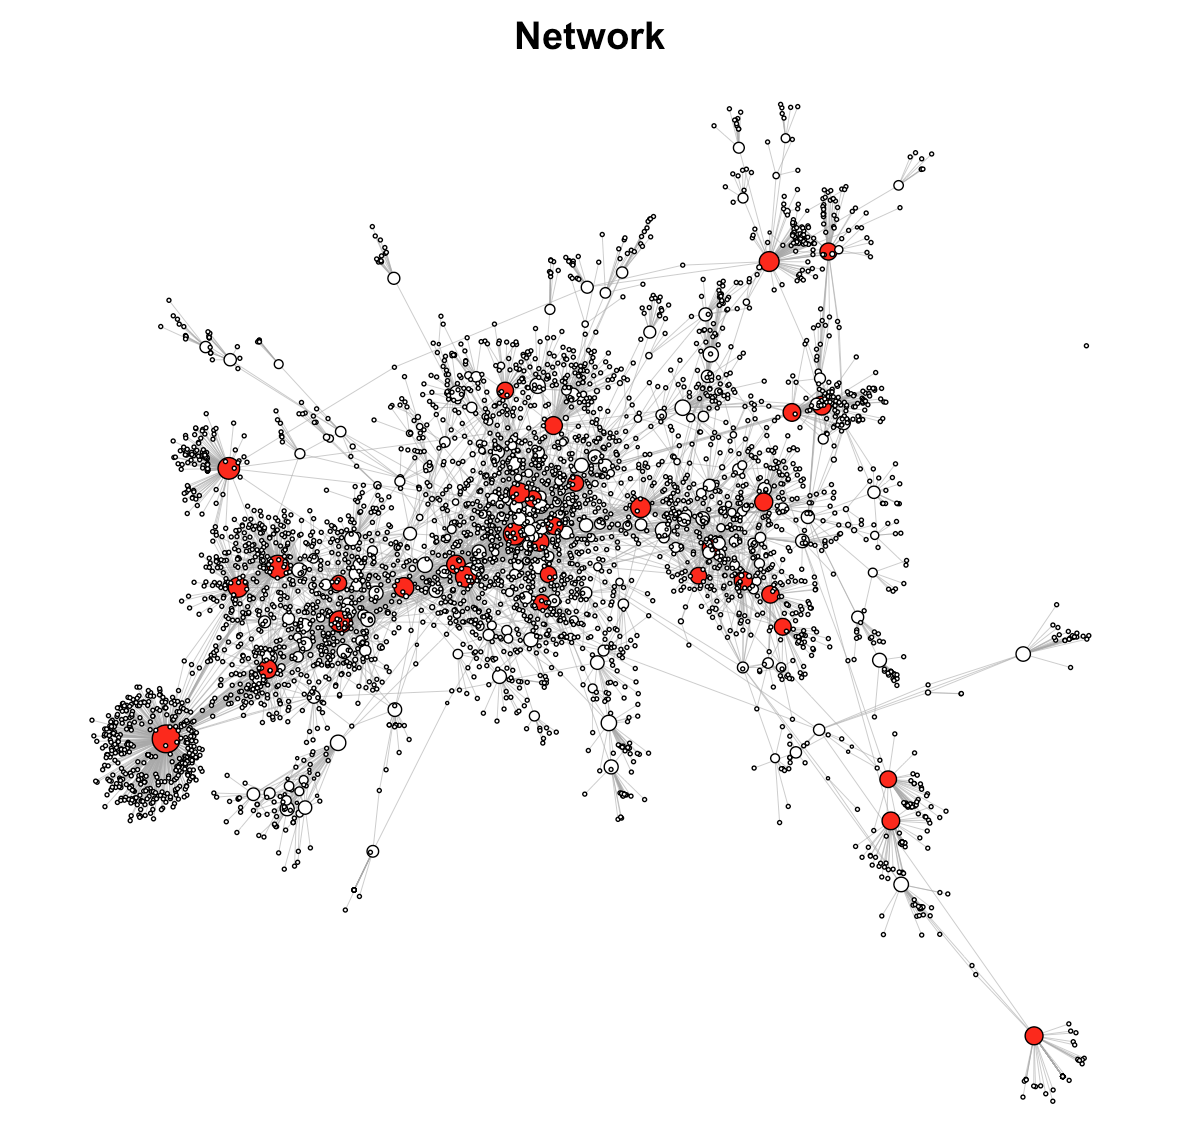
In total the script found 4162 unique articles with some 5387 edges between them. The average number of citations of each paper was 9, but the distribution is obviously heavily skrewed. In the graph I’ve highlighted the nodes with 30 or more citations. All node sizes are also dependent on number of citations – and as outlined in the code above, you can easily create a reading list from these. Another approach was to identify the top 10 last authors within the network, which is also included in the code.
A couple of notes:
- The for-loop for scraping PubMed are somewhat slow – probably there’s a better way to to this.
- PubMed summary information only shows references from Pubmed Central articles, not all referring liteterature. This means the network won’t be complete, but I hope the highly connected nodes are representative.
- The cutoff number of 30 used above was somewhat randomly picked – here I basically set it to find a manageable number of articles to read.
- I struggled the most with visualizing the layout in igraph. For the figure above I used the Fruchterman-Reingold layout algorithm, but it’s worth to play around with both layout and the edge and vertix settings. Katherine Ognyanova’s guide was great in explaining how to setup the graph – be sure to read it!
It’s a lot of fun to play around with igraph which has a lot more functions then I am using here. For example it would be cool to identify clusters within the network, like Mark Thorton beautifully did using book styles, or use another matric the just incoming connections to identify key nodes (i.e. key articles).